
HomeServicesContact
Business Automation SystemsWebsite, SEO & Digital MarketingDashboards & Reporting

Dashboards & Reporting Systems

Start by finding where the numbers actually come from.

Data source audit

Start by finding where the numbers actually come from.

Before a dashboard is built, the sources need to be mapped: CRM, spreadsheets, forms, finance files, operations trackers, campaign data, and the manual updates people still rely on.

  • Source mapping
  • Data quality review
  • Reporting gaps
Scope this service
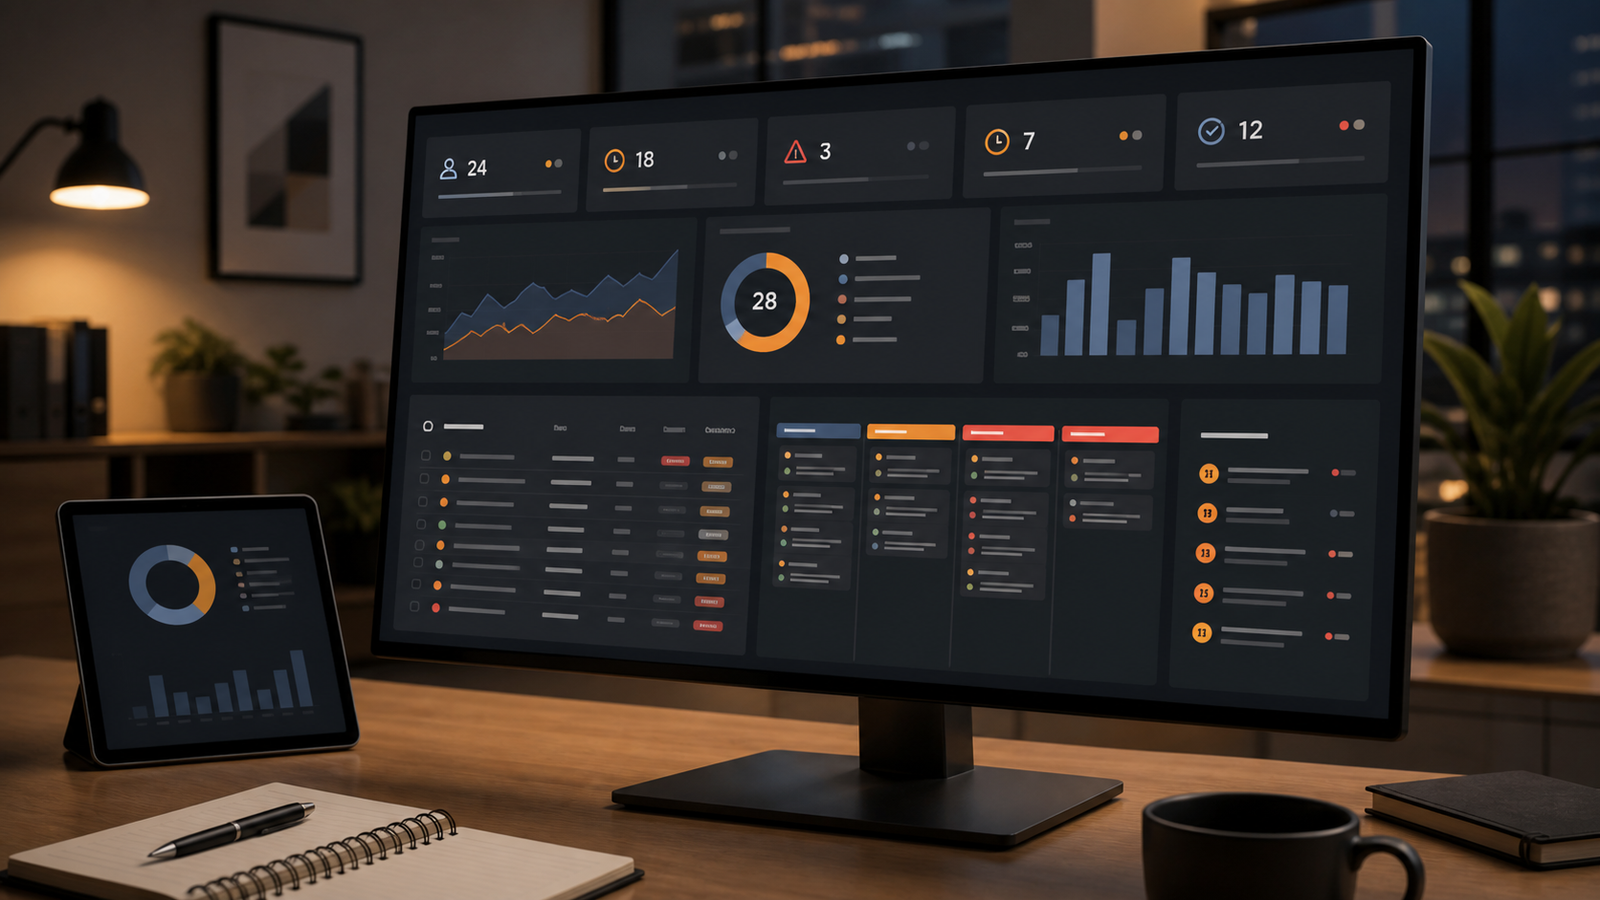
One screen for open work, delays, and follow-up.

Management view

One screen for open work, delays, and follow-up.

A useful dashboard does not try to show everything. It shows the work waiting for action, the bottlenecks that are slowing the team, and the signals that help managers decide what to do next.

  • Open workload
  • Overdue actions
  • Sales and operations visibility
Scope this service
Make the problems visible before someone has to ask.

Alerts and exceptions

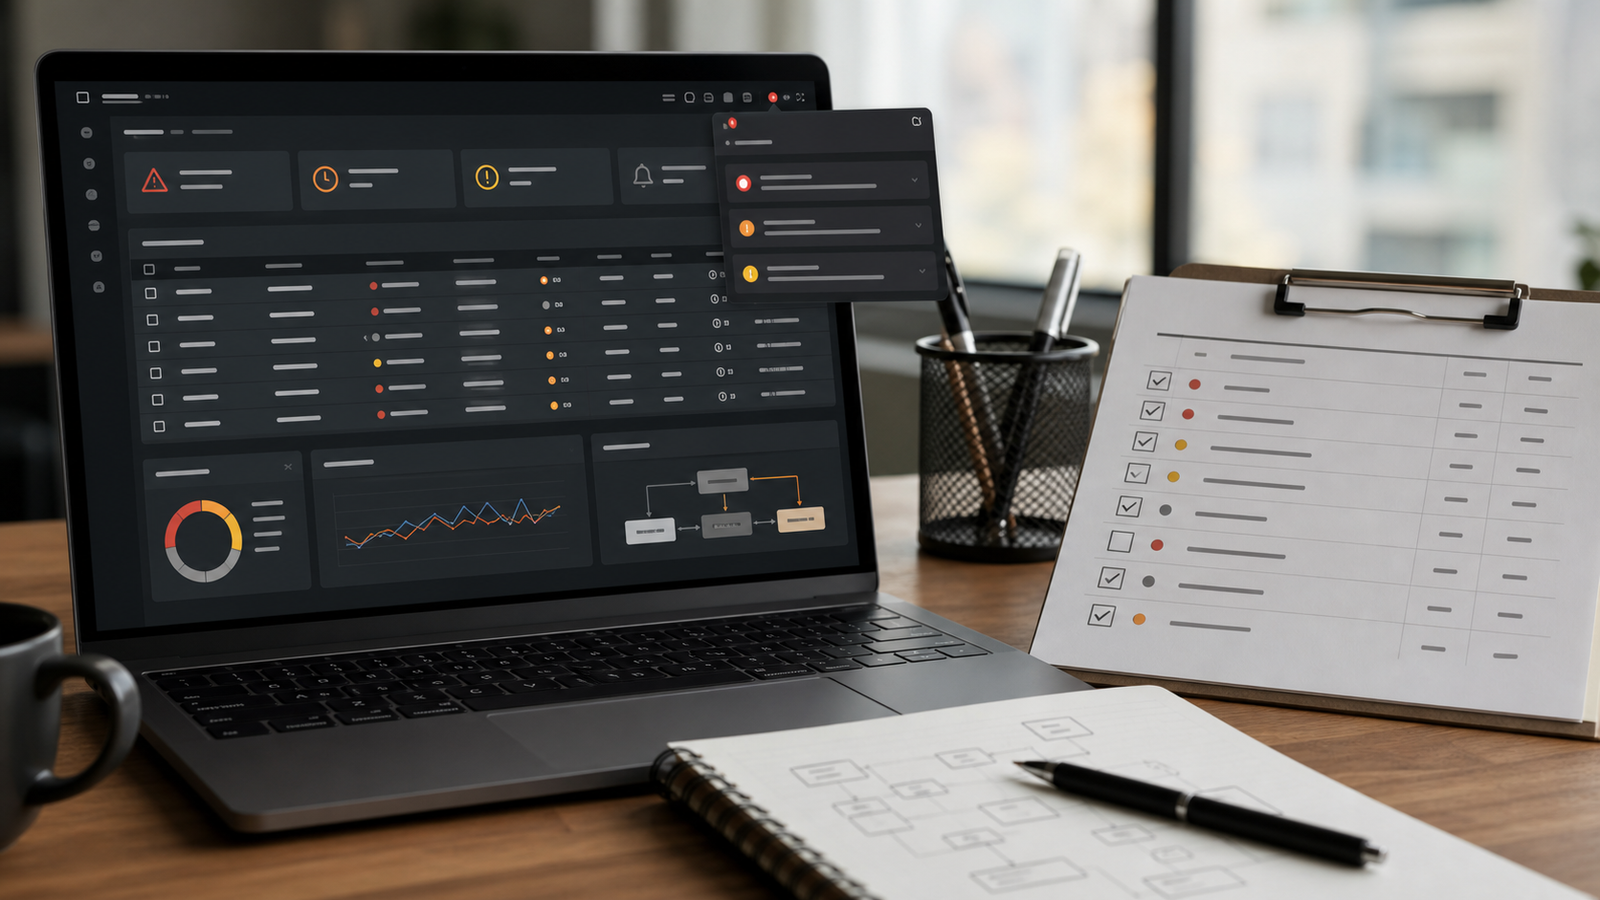
Make the problems visible before someone has to ask.

Late follow-up, missing documents, blocked tasks, stale CRM records, and delayed approvals should appear as exceptions the team can act on.

  • Overdue alerts
  • Missing-data flags
  • Escalation rules
Scope this service
Reports built for decisions, not decoration.

Weekly owner reporting

Reports built for decisions, not decoration.

The weekly view should summarize what changed, what needs attention, and which owner decisions are waiting, without rebuilding a slide or spreadsheet from scratch.

  • Weekly summary
  • Decision list
  • Action ownership
Scope this service

Why it matters

A dashboard is useful only when it shows the next decision.

Reports are rebuilt manually from spreadsheets every week

Sales, operations, finance, and marketing numbers live in separate places

Owners see totals but not who needs to act

Late tasks and missing data are found by asking the team

Meetings start with collecting numbers instead of deciding what to fix

What the dashboard should make visible

01

Sales pipeline

Show active opportunities, quote status, follow-up dates, stalled deals, and the work sales needs to move today.

Pipeline reports are often based on outdated CRM stages or manual notes. Quotes are sent, but the next callback, owner, and real status are not visible.

  • CRM stages drift from reality
  • Quotes have no next follow-up date
  • Managers cannot see stalled opportunities
What the finished reporting system gives the team

What the finished reporting system gives the team

A clear list of where the information comes from, which source is trusted, what is updated manually, and where gaps or duplicates need cleanup.

  • Source list
  • Ownership
  • Data gaps

Frequently asked questions

No. The first step is often to find where the data is messy, duplicated, missing, or updated manually. That audit defines what the first dashboard can trust.

Scope the First Reporting View

Send the tools, spreadsheets, CRM, forms, or reports your team uses today. The first scope should define the source map, KPI definitions, dashboard view, alert rules, and reporting rhythm before a larger system is built.

Discuss the Dashboard

Directory

Related services